Visit any industrial automation conference or walk any automation industry tradeshow floor lately and you’re bound to see and hear the marketing buzzwords “IoT” and “Cloud” in abundance. Of late, these have been joined by “AI”, “Machine Learning”, and “Analytics.” It seems that there’s an exciting new world just over the horizon. Conspicuously lacking in the conversation, however, are specifics: How does one “do IoT”? Why does one “do IoT”? We’re going to address the question of how here, with specificity. The question of why we’ll save for another day. In this article, we’ll get down to the brass tacks on IoT.
The catalyst for this activity was a recent training webinar on Microsoft’s Power BI. It’s a powerful, intuitive, and undeniably slick reporting package from Microsoft. Even better, it’s free (for a limited, cloud based starter version).
https://powerbi.microsoft.com/en-us/
Notably, the software can consume and present data from practically any data source. I began to wonder how it might be used to present information from a manufacturing data source. To find the answer, I resolved to assemble just such a solution. It’s not quite as simple as the marketers might have you believe, but it is possible, and the potential up-side makes it worth the effort:
Step 1: Plant Data
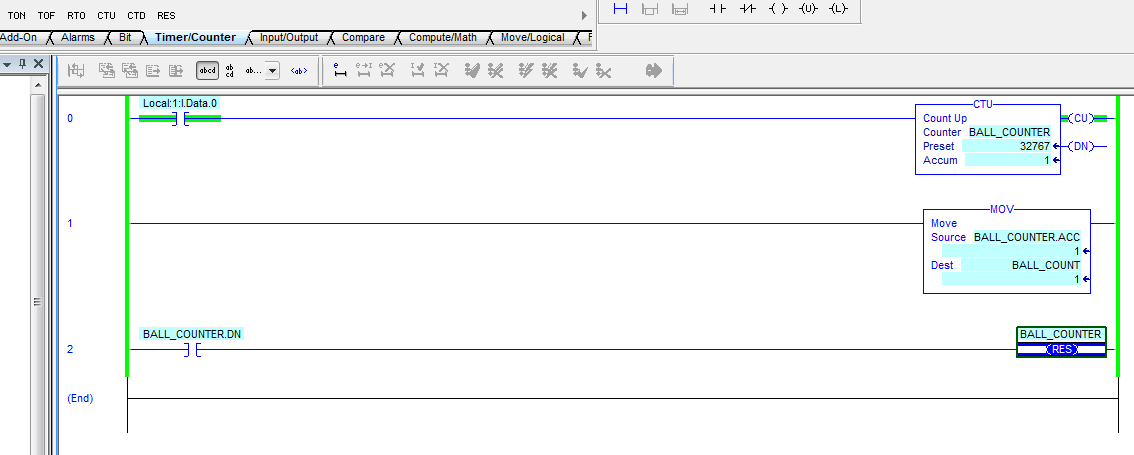
 For those of you who have visited us at a trade show, you may already be familiar with our “golf ball machine.” For the uninitiated, it’s a simple test platform with a chain that lifts golf balls to the top and then lets them roll down a series of channels until they reach the bottom where the cycle is repeated. We built the machine as a training platform and a testbed. It’s well suited for a small test project like this one. For the IoT exercise at hand, we’ll just run the chain at varying speeds and use the photoeye at the top of the chain to count how many balls have been “processed.”
The program is a simple one, running on the installed ControlLogix L72 processor, with a counter tied to the input for the photoeye, which rolls over at 32767. For simplicity, the count is moved into a controller scoped DINT called “BALL_COUNT.”
Step 2: KEPServer Setup
The next task, is to get the data to the cloud. There are a variety of ways to do this, and a variety of definitions of “the cloud.” For my purposes, my aim is to get the data securely to a place where I can access it from a Power BI report.
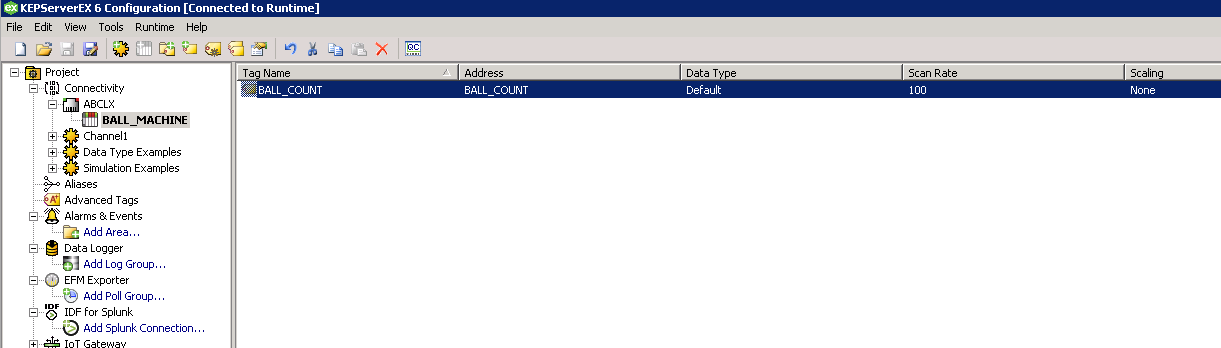
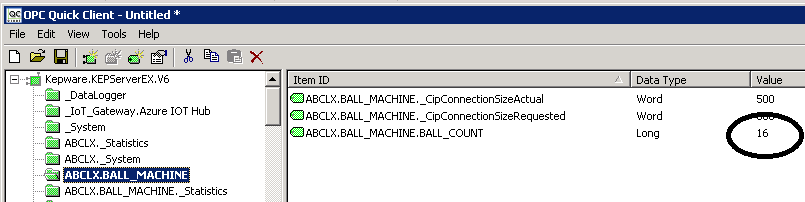
Being a long-time fan of KEPServerEX, I smiled when I was reminded of the built-in KEPServer “IoT Gateway.” I’d noticed the feature in the KEPServerEX tree during a recent project, but hadn’t yet found a need to use it. I downloaded and installed a trial version of KEPServerEX (free for 2 hours) onto a virtual server and went about the usual configuration steps: Driver… Device… Tag… to get the data from the PLC into KEPServer. Then I ran the OPC test client to verify connectivity:
Up until this point, this is a pretty standard PLC to OPC server setup, and one that is probably familiar to many of our clients. Now, how do we get this data to “the cloud?”
Summary
In the next post I’ll show how to connect KEPServer to the IoT Hub and how to configure the IoT Hub to handle the data.
– Jason


