This is the conclusion of our 3-part “IoT Brass Tacks” series. If you haven’t had a chance to look over the first two parts, they can be found here:
http://www.talosengineering.com/iot-brass-tacks-part-1 and here: http://www.talosengineering.com/iot-brass-tacks-part-2
Step 5: Azure Stream Analytics
At this point, the ball count production data is arriving at the IoT Hub, and I’ve got an Azure-based SQL Server instance ready to receive and store the data. The glue that holds this all together is Azure Stream Analytics.
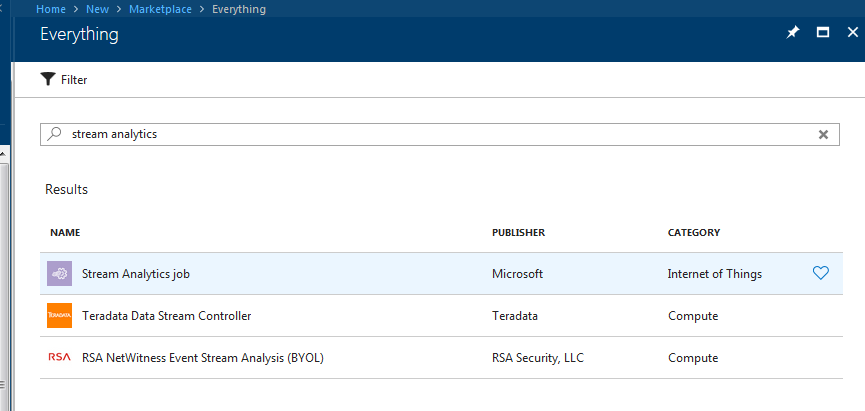
Once again, in Azure Portal we select “Create Resource” and type in “stream analytics” before selecting “Azure Stream Analytics Job…”
There are quite a few helpful tutorials out there on creating a Stream Analytics job to pass IoT Hub data to a SQL Server. In essence, we define an input, an output, and then a query to tie the two together:
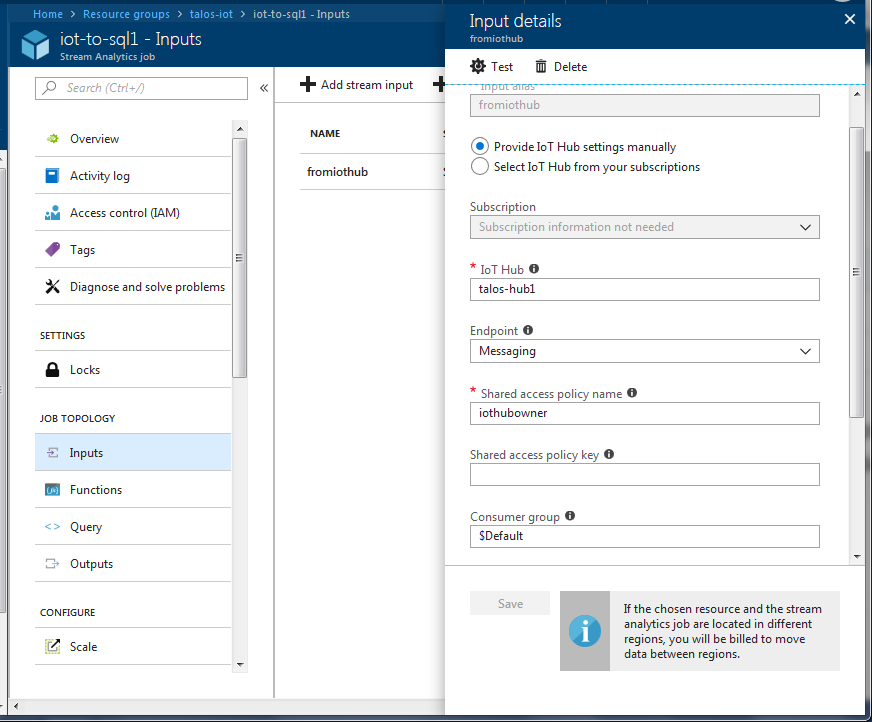
First the input (the IoT Hub Message data):
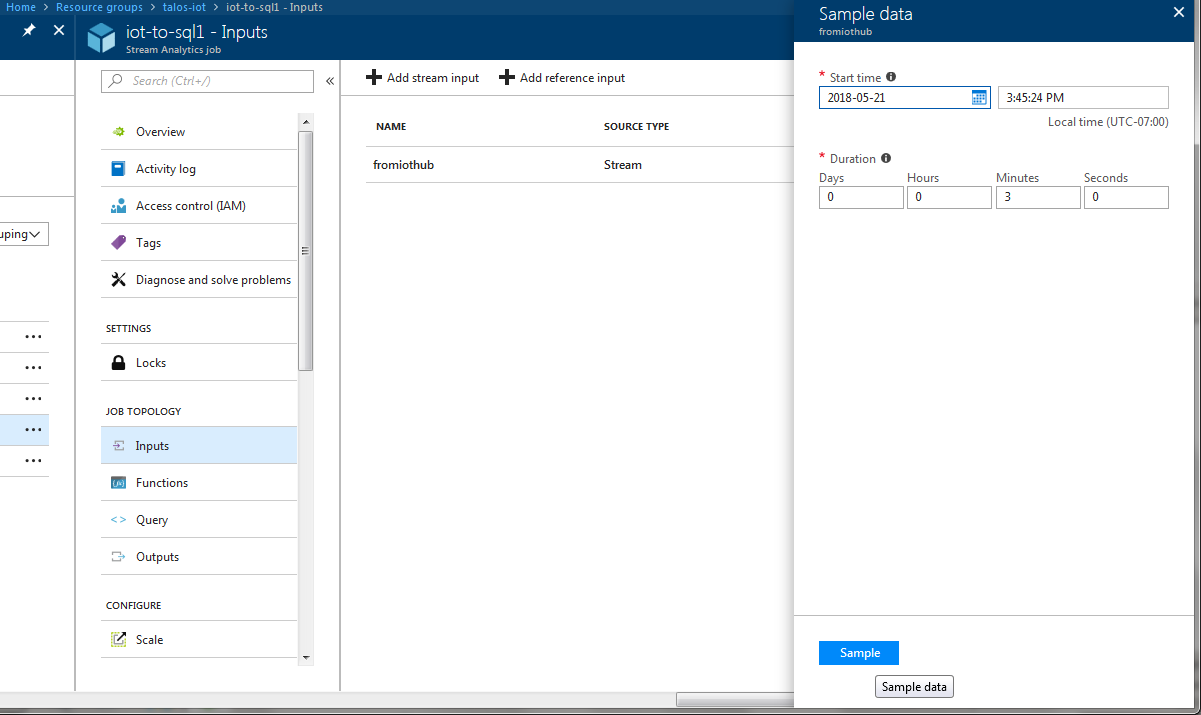
To understand how the data comes in, it was useful on the Input screen to click “Sample” on the Input screen to gather data for a few minutes:
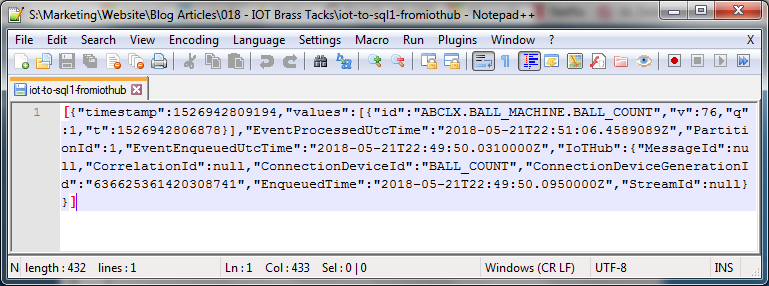
This produces a handy text file which can be downloaded and then used for testing your Query:
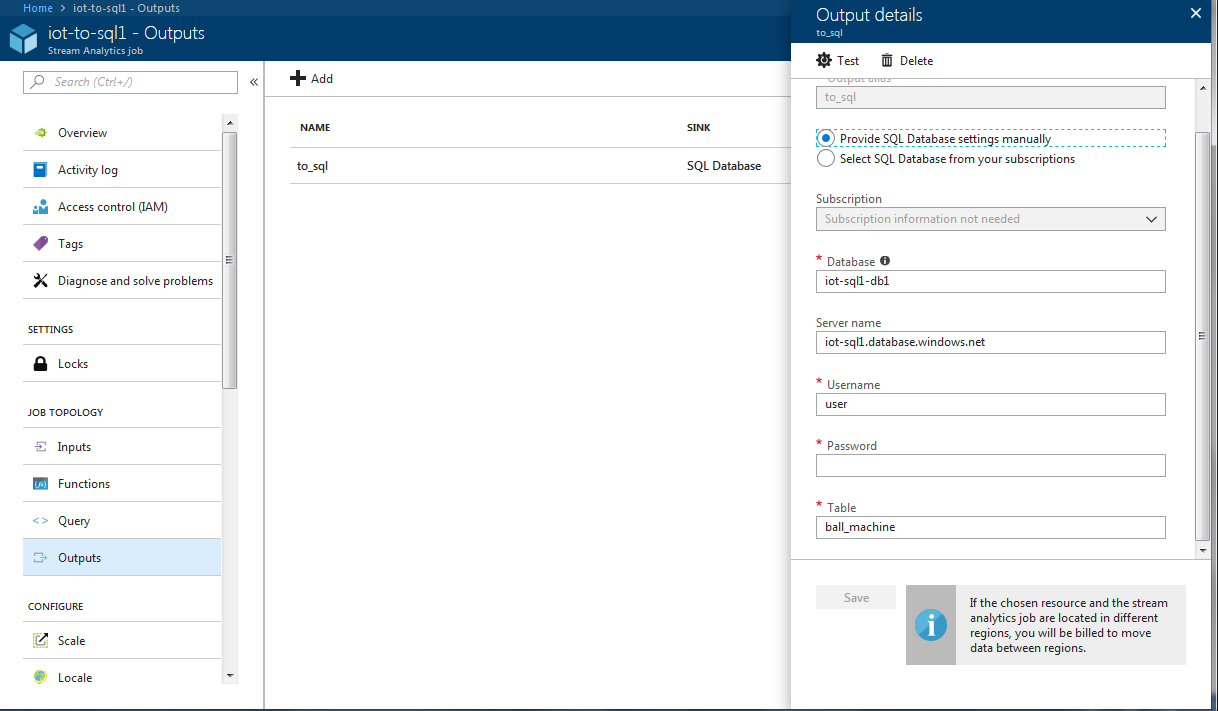
Next, create an output to connect to the SQL database and table that we created earlier:
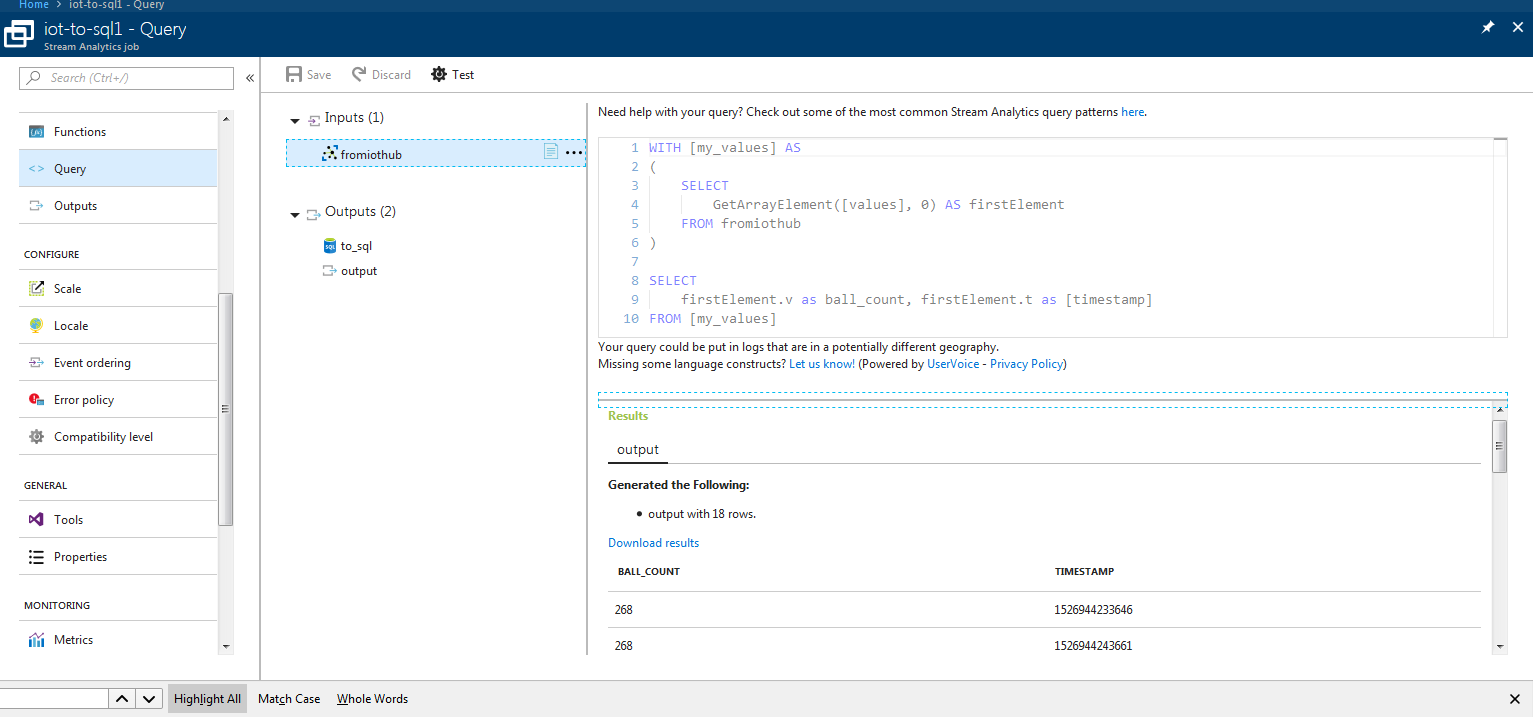
Finally, for the query. First, upload the sample date to the input (click the … next to the input). Then go about writing the query and hit “test” to view the result. Here’s the query I came up with, along with the results obtained from the test data:
Once the results are what you expect (in our case, they should match the format of our SQL table), you can start the Job from the Overview screen. Confirm that Azure reports “Streaming Job Started Successfully.”
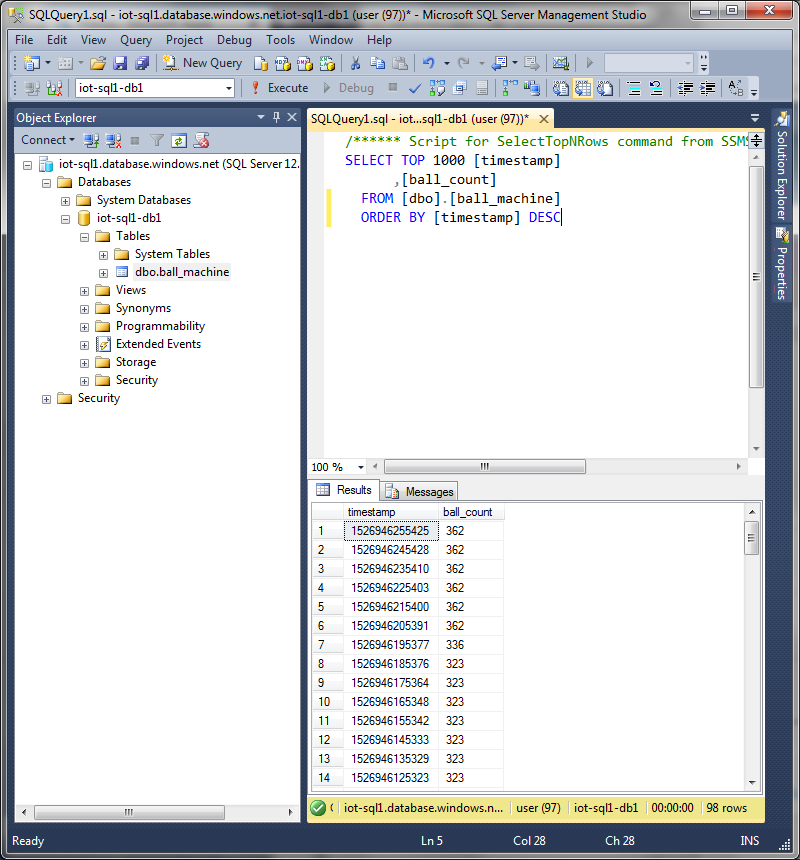
To confirm that the data is being logged in SQL, use Management Studio and run the appropriate SELECT query:
Once I’d confirmed that the raw data was coming into SQL, I added a couple of views to parse the data and put it in a format suitable for consumption in Power BI. Certainly this work could have been done in Stream Analytics just as well, but I’m more comfortable in SQL.
The first view takes the millisecond timestamp from KEPServer and makes it into a SQL datetime:

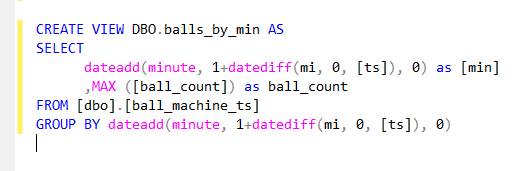
The next view ensures that we return no more than one record for each minute, and formats the ball count as an integer:
Step 6: Power BI
Now, download and install Power BI Desktop from powerbi.microsoft.com.
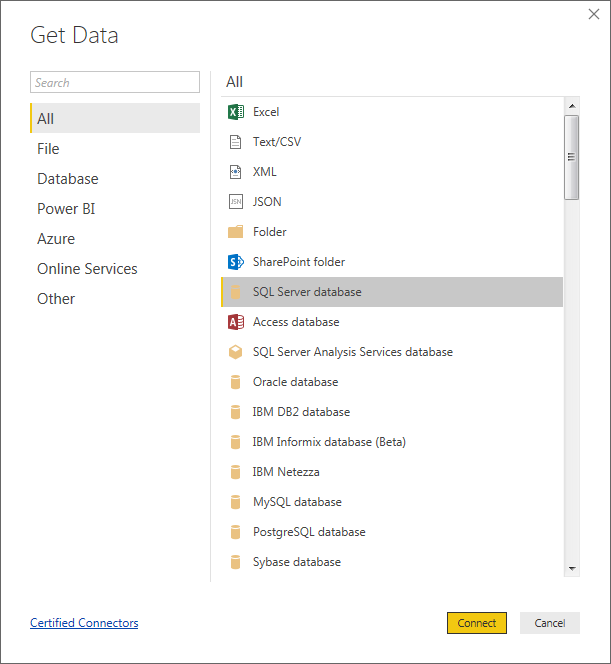
To connect to our SQL data, we’ll click “Get Data” and then “SQL Server Database.”
For the server, use the same hostname that we used in SQL Management Studio, and specify the same database name as we used for our output in Azure Stream Analytics.
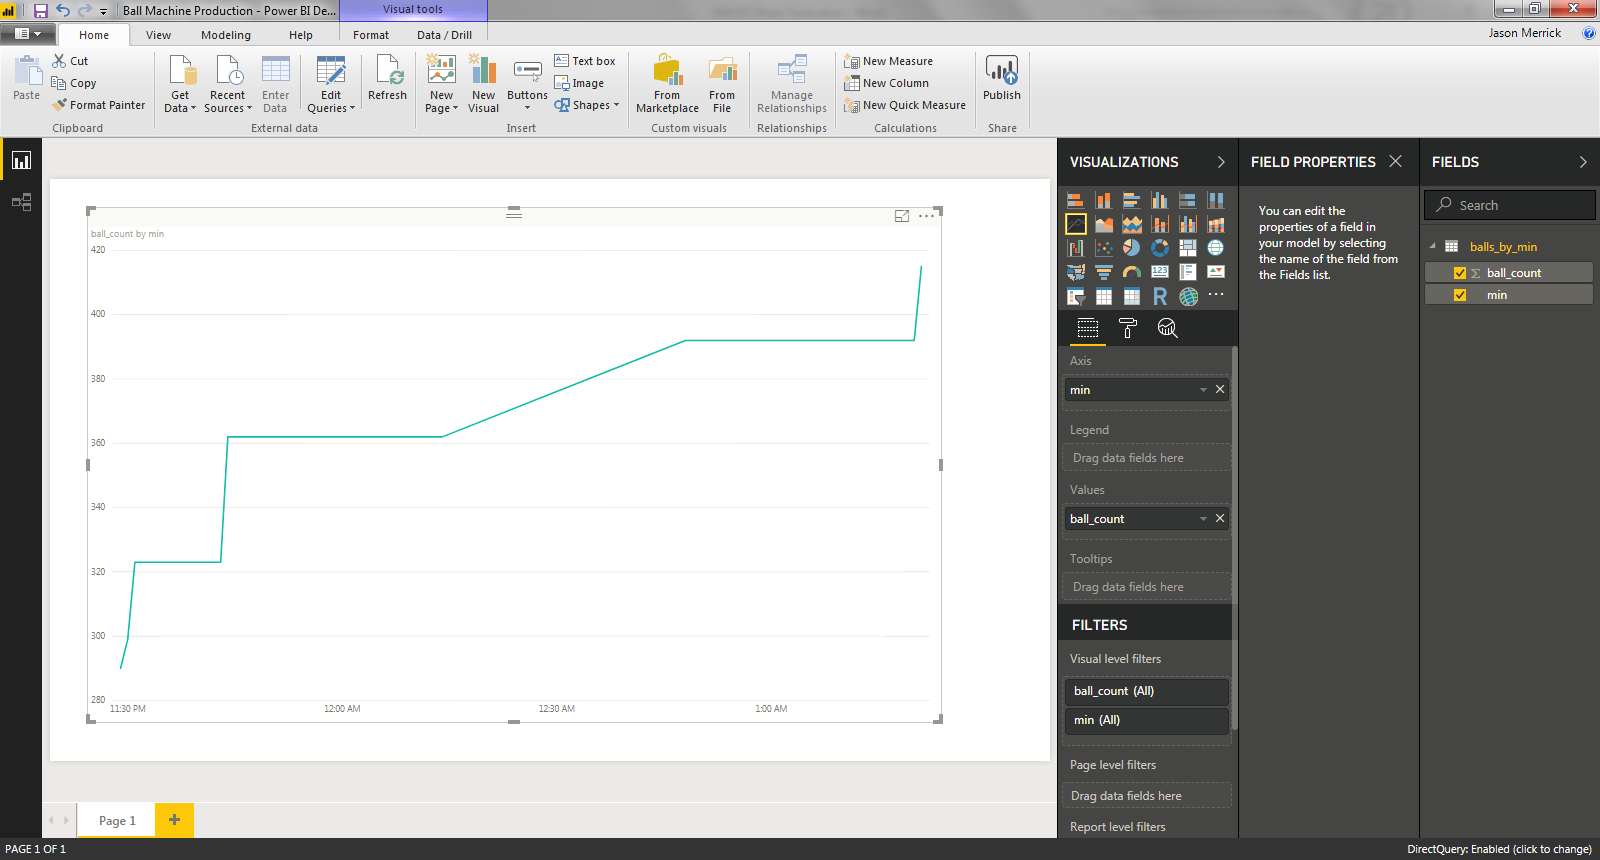
Change the connectivity mode to “DirectQuery” to allow the report to pull data on-demand.
On the following screen, you should see a preview of the data. Click “Load.”
Click on “Line Chart” to add a line chart, and drag the min and ball_count fields to the “Axis” and “Values” fields, respectively.
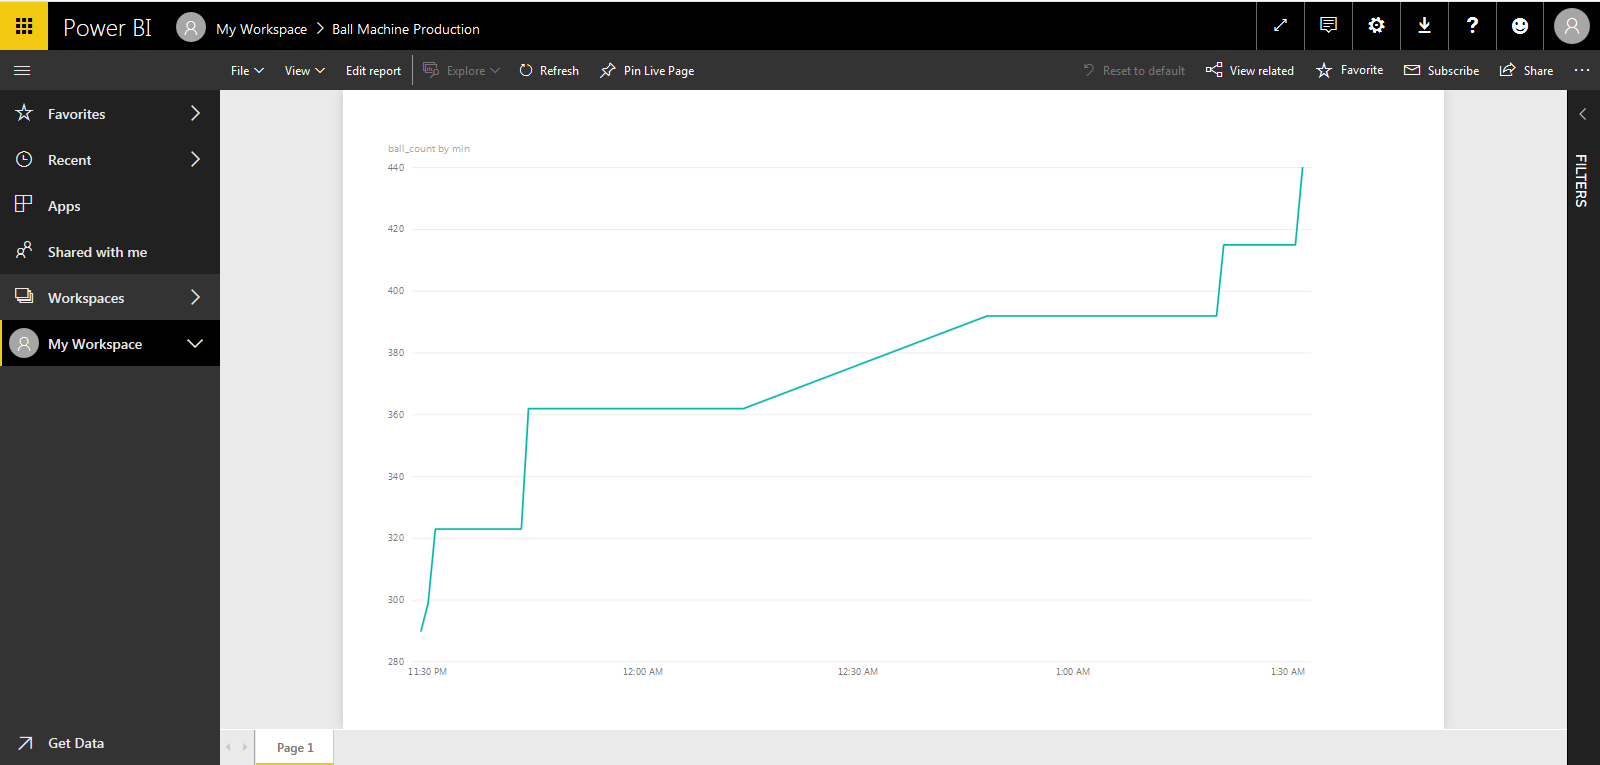
Now, save the report and hit the “Publish” button it so that it’s accessible on the cloud too:
Summary
Hopefully this walk-through fills in some gaps on one approach to the “how” of IoT. It should be apparent that the undertaking isn’t trivial, but depending on your answer to the “why” of IoT, you may find it well worthwhile.
If you see something here that I’ve made a mistake on, or that you have questions about, please feel free to reach out.
– Jason
509-893-5799


