Reporting software is one of our primary weapons in the battle to turn production data into “actionable” information. Rockwell Automation’s VantagePoint (formerly Incuity) is one of the most versatile reporting packages available. This is owed to its ability to connect with myriad data sources, model data in a unified representation of the plant, and display the information using any of several publishing mechanisms.
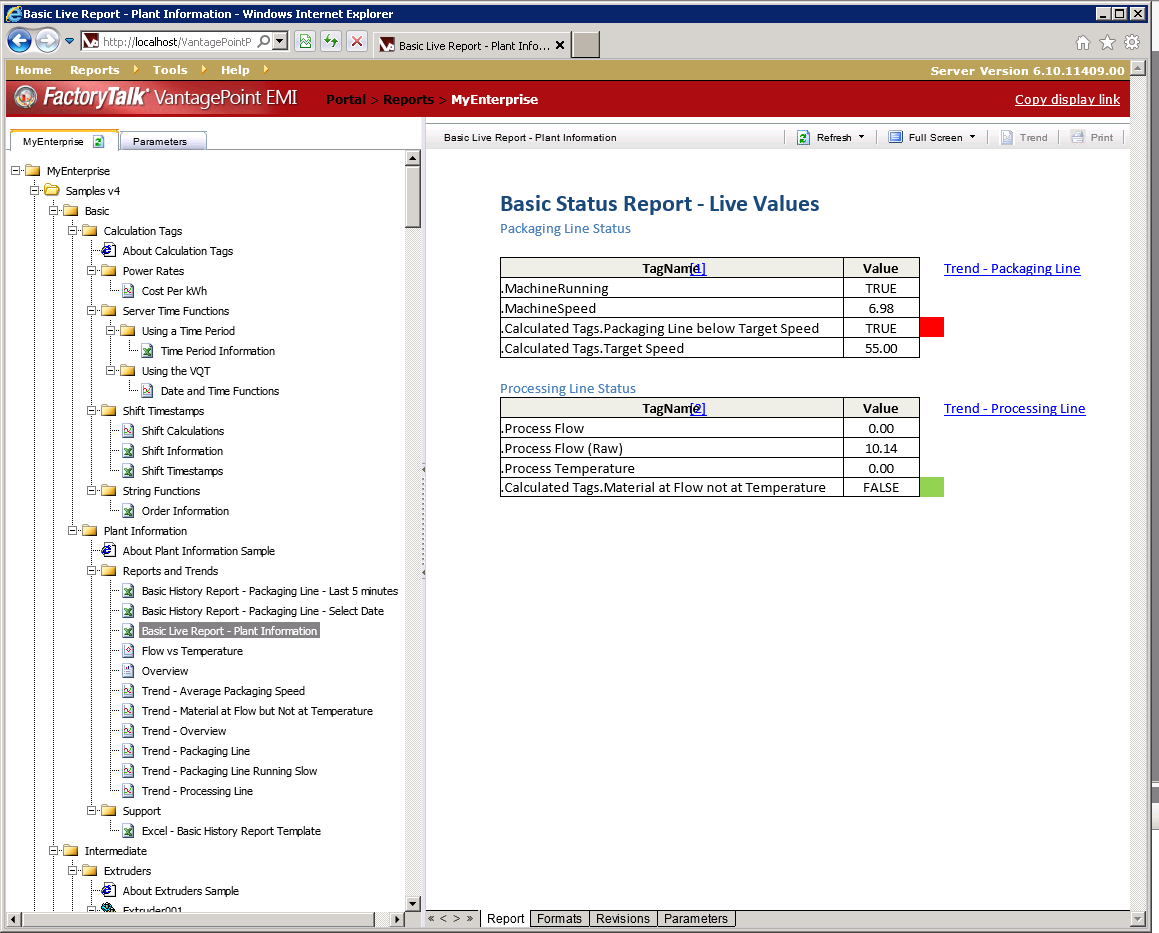
As with other reporting packages, VantagePoint reports can provide insight into how equipment is functioning, downtime causes, and quality parameters by utilizing process data such as, level, pressure, weight, and temperature. The information displayed can be useful to numerous people at a plant or facility: An equipment operator or maintenance team might use it to look for performance issues and maintenance cues to avoid downtime and increase performance. A production manager might look at the numbers for product produced, product wasted, line stops, and downtime.
In this article, we’ll explore a couple of the options for building reports in VantagePoint and examine the pros and cons of each.
Getting Started
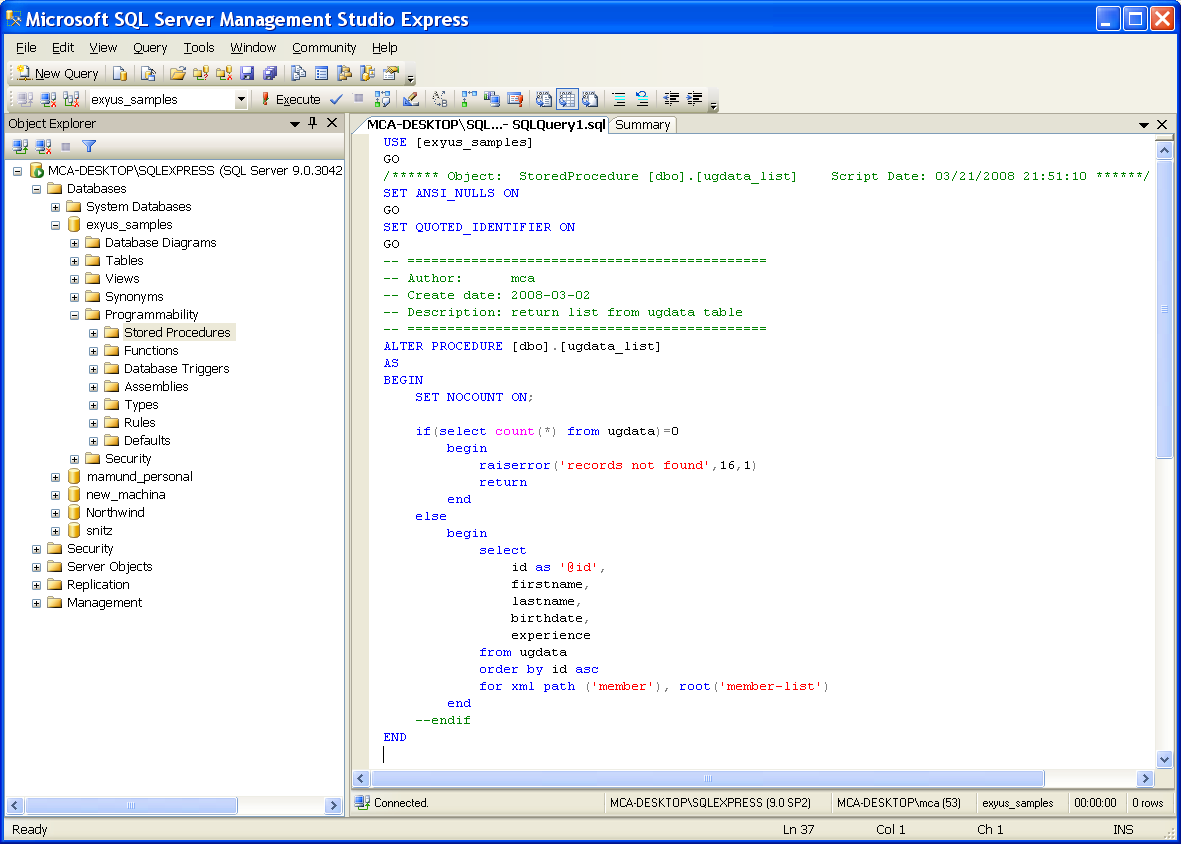
The method used to generate a VantagePoint report can range from relatively straightforward to highly complex. Simply put, it may require a somewhat advanced skill-set to modify a ‘simple’ report without engaging external resources. Being relatively new to VantagePoint I discovered this the hard way. I was recently asked by a client to re-create an existing VantagePoint report. This report was originally built by an integrator using a Microsoft SQL Server stored procedure. This report broke when upgrades were performed at the plant and the underlying equipment was modified. Rockwell support does not include help with SQL, only VantagePoint. I want to use this experience to review the types of reports that can be created within VantagePoint and how they are different.
SQL Stored Procedure Based Report
The VantagePoint SQL CLR feature is a powerful feature that enables VantagePoint users to access the model by way of SQL stored procedures and functions. These can be written to grab historian tags, run queries and feed data to VantagePoint to view as a report. This is very useful if you are an expert in SQL and understand the commands and syntax. The feature can also be a big help when processing large amounts of data to produce a report quickly. However, if you or your plant staff are not familiar with SQL you can find yourself in trouble when it comes time to make updates. Rockwell support will provide help on VantagePoint software but SQL procedures are a separate issue all together. This can cause issues later down the road when reports are broken due to upgrades, network changes, or new additions, and need to be updated. Or simply when more data is requested to be added to the report or the report changed at a later time.
VantagePoint Excel Based Report
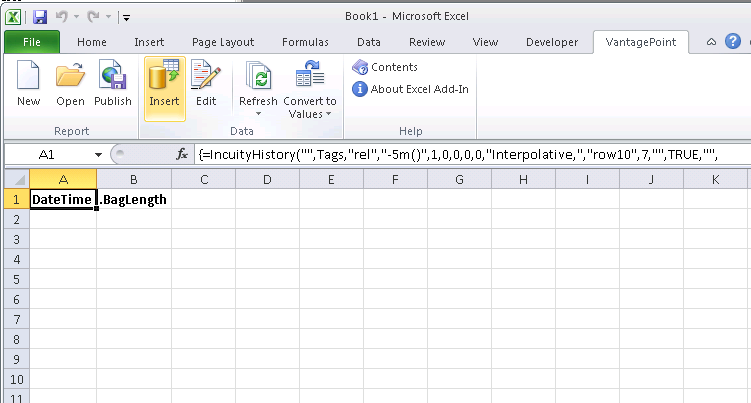
Fortunately, VantagePoint also includes an Add-In for Microsoft Excel that allows you to create and publish VantagePoint reports using Excel formulas and formatting. There is a menu based popup that allows you to pull data from VantagePoint tags for certain time frames, ranges, and current values. Once you have the data into Excel, you can use any Excel formula or feature to manipulate the data. You can then use Excel built in graphs and charts to plot data that you have organized into a visual. This is a nice benefit because Rockwell support is available for the Add-In. If you run into issues, and there are multiple tutorials, books, and even support available for Microsoft Excel. This provides the user friendly and supported environment to build and maintain reports. Bear in mind that this approach to reporting does come with something of a performance hit, since Excel needs to run in the background on the server in order to produce the report. Depending on your situation, this may be an acceptable trade-off for the simpler maintenance.
So, if you are looking at setting up VantagePoint reports, be aware of your options. Not all VantagePoint reports are the same and this can affect your support and ease of use later down the road.
In a future post we’ll explore creating reports using VantagePoint’s Dashboard Builder.


